20180808 Pandas 入門
Pandas為一個Python的數據分析模塊,
從資料(如內部的Python資料、外部的Html, CSV)來源,
主要可以做兩種資料結構的整理:
Series(序列式)的一維陣列,
DataFrame(表格式)的二維資料集,
並且Pandas還有一些篩選和資料統計的功能,
強大又簡單來整理需要的資訊。
因為Pandas功能不少,整理起來有點複雜,這邊做一些入門介紹。
- 安裝Pandas
- 輸入資料
- 資料查看和處理
- 輸出資料
一、安裝Pandas
cmd 執行 pip3 install pandas
二、輸入資料
導入模組的語法:
import pandas as pd # 導入Pandas模組
取用內部資料的方法:
# 以series方式取得list資料
list = ['A','B','C']
select_l = pd.Series(list)
print (select_l)

###Output###
0    A
1    B
2    C
dtype: object

# 以series方式取得dict資料
dict = {'A':'a','B':'b','C':'c'}
select_d = pd.Series(dict)
#select_d = pd.Series(dict, index = dict.keys())
print (select_d)

###Output###
0    A
1    B
2    C
dtype: object
# 以dataframe方式取得dict資料
dict = {'upper':['A','B','C'],'lower':['a','b','c']}
d_df = pd.DataFrame(dict2)
d_df

###Output###
    upper    lower
0    A    a
1    B    b
2    C    c

# 以dataframe的方式取的array的資料
arr = [['A','a','1'],['B','b','2'],['C','c','3']]
ar_df = pd.DataFrame(arr, columns = ['upper', 'lower','num'])
ar_df

###Output###
   upper lower num
0    A    a    1
1    B    b    2
2    C    c    3
取用外部資料的方法:
# 導入模組
import pandas as pd

### 讀取 CSV File
cdf = pd.read_csv('這裡輸入副檔名為csv的路徑', encoding='utf8')
cdf
### 讀取Html url
hdf = pd.read_html('http://rate.bot.com.tw/xrt?Lang=zh-TW')
hfs[0]
三、資料查看和處理
cdf為前面import的csv資料 (以下範例為Kaggle的FIFA2018_matchs的資料)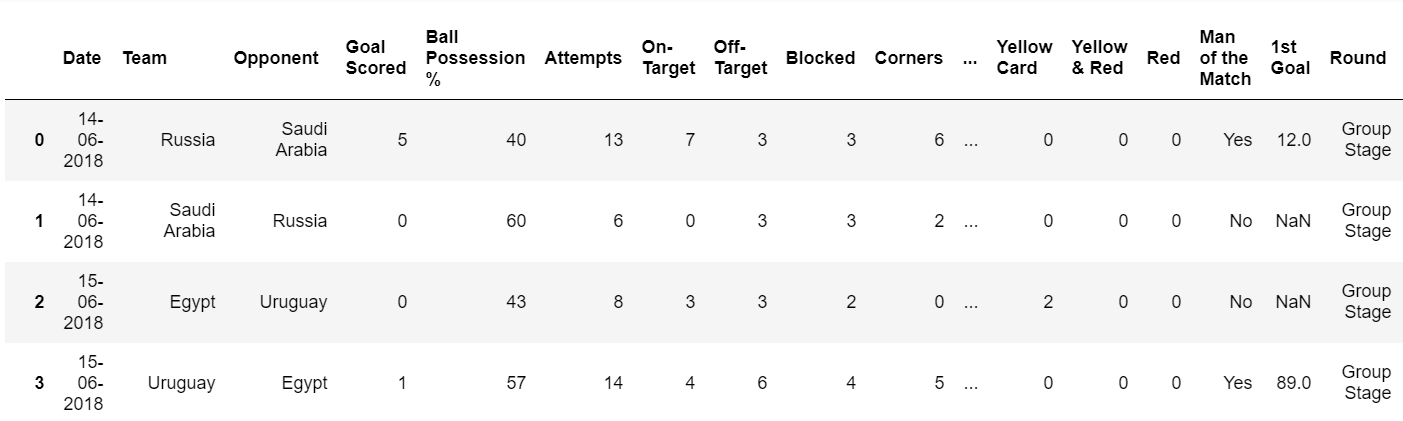
[查看資料與統計]
#選擇查看的資料
cdf.columns #查看欄位名稱
cdf.head(3) #前三筆
cdf.tail(3) #後三筆

#查看統計結果
cdf.sum() #加總
cdf.mean() #平均
cdf.median() #中位數
cdf.describe([0.25,0.5,0.75]) #將含數值的欄位描述成統計表,[]內為預設%數之統計,可刪除或增減項目。
(cdf.describe 示意圖)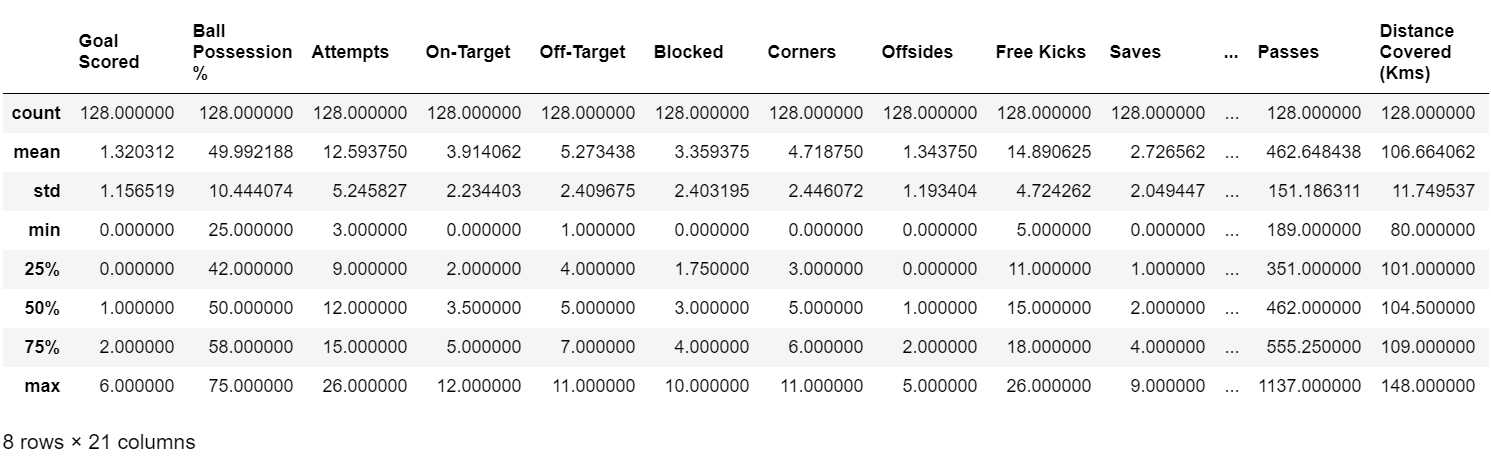
[處理資料]
- 新增
#新增欄

#新增一欄名叫new_columns,值為test
cdf['new_columns']= 'test'
#新增一欄名叫Target-delta,值為On-Target與Off-Target相減
cdf['Target-delta'] = cdf['On-Target']-cdf['Off-Target']

#新增列

#新增一欄列叫new_row,值為test
cdf.loc['new_row']= 'test'
- 刪除
#刪除列與欄
#語法 : cdf.drop(labels=None,axis=0, index=None, columns=None, inplace=False)

#刪除列 index(row), axis=0
cdf.drop(index=[0,1,2],axis=0) #刪除1~3列

#刪除欄 columns, axis=1
cdf.drop(['Date','Attempts'],axis=1) #刪除欄位by欄位名稱
cdf.drop(cdf.columns[[0,5]] ,axis=1) #刪除欄位by欄位位置

#同時刪除列和欄
cdf.drop(index=[0,1,2],columns=['Date','Attempts']) #刪除1~3列以及Date,Attempts欄
#取代資料原資料
cdf.drop(index=[0,1,2],axis=0, inplace=True) #刪除1~3列並取代原表
- 篩選與排序
#篩選與排序

#只取欄位Team, Opponent, Goal Scored
cdf[['Team','Opponent','Goal Scored']]
#同上,並照 Goal Scored 大到小(ascrending=False)排序
cdf[['Team','Opponent','Goal Scored']].sort_values(by='Goal Scored' , ascending=False)
(cdf 取Team, Opponent, Goal Scored 並以Goal Scored排序)
#只顯示比利時的比賽
cdf[(cdf['Team']=='Belgium')]

#只顯示比利時的比賽並只查看Team, Opponent, Goal Scored三個欄位
cdf[(cdf['Team']=='Belgium')][['Team','Opponent','Goal Scored']]

#只顯示比利時沒進球的比賽
cdf[(cdf['Team']=='Belgium')&(cdf['Goal Scored']==0)]  #使用|和&採聯集或交集

#只顯示比利時的比賽並照'Goal Scored'大到小排序
cdf[(cdf['Team']=='Belgium').sort_values(by='Goal Scored' , ascending=False)

#計算比利時的總進球數
cdf[(cdf['Team']=='Belgium')][['Goal Scored']].sum()
(只顯示比利時的比賽指查看Team, Opponent, Goal Scored欄位)
(計算比利時的總進球數)
四、輸出資料
最後Pandas當然也可以將資料輸出,
除了常見的txt, csv, excel 還有很多方式。
可參考: Pandas I/O tool
示範最陽春的輸出CSV語法如下:
result = cdf[(cdf['Team']=='Belgium')][['Team','Opponent','Goal Scored']]
result.to_csv(r'C:\Belgium.csv')
*更多用法: http://pandas.pydata.org/pandas-docs/stable/tutorials.html